
Check Point® Software Technologies Ltd.(link is external) announced major advancements to its family of Quantum Force Security Gateways(link is external).
Overrated/Underrated: What Quality Metrics Really Matter for DevOps Success?
July 18, 2019
The way that we develop and deliver software has changed dramatically in the past 5 years — but the metrics we use to measure quality remain largely the same. Despite seismic shifts in business expectations, development methodologies, system architectures, and team structures, most organizations still rely on quality metrics that were designed for a much different era.
Every other aspect of application delivery has been scrutinized and optimized as we transform our processes for DevOps. Why not put quality metrics under the microscope as well?
Are metrics like number of automated tests, test case coverage, and pass/fail rate important in the context of DevOps, where the goal is immediate insight into whether a given release candidate has an acceptable level of risk? What other metrics can help us ensure that the steady stream of updates don’t undermine the very user experience that we’re working so hard to enhance?
To provide the DevOps community an objective perspective on what quality metrics are most critical for DevOps success, Tricentis commissioned Forrester to research the topic. The results are published in a new ebook, Forrester Research on DevOps Quality Metrics that Matter: 75 Common Metrics—Ranked by Industry Experts(link is external).
The goal was to analyze how DevOps leaders measured and valued 75 quality metrics (selected by Forrester), then identify which metrics matter most for DevOps success. Here’s a look at the process:
1. Survey 603 global enterprise leaders responsible for their firms’ DevOps strategies.
2. From that sample, identify the firms with mature and successful DevOps adoptions (157 met Forrester’s criteria for this distinction).
3. Learn what quality metrics those experts actually measure, and how valuable they rate each metric that they regularly measure.
4. Use those findings to rate and rank each metric’s usage (how often experts use the metric) and value (how highly experts value the metric).
5. Compare the DevOps experts’ quality metric usage vs that of DevOps laggards. If there was a significant discrepancy, the metric is considered a DevOps differentiator.
The 75 DevOps quality metrics were divided into 4 categories:
■ Build
■ Functional validation
■ Integration testing
■ End-to-end regression testing
For each category of quality metrics, we came up with a heat map showing usage vs. value rankings. For example, here is the heat map for the Build category metrics.
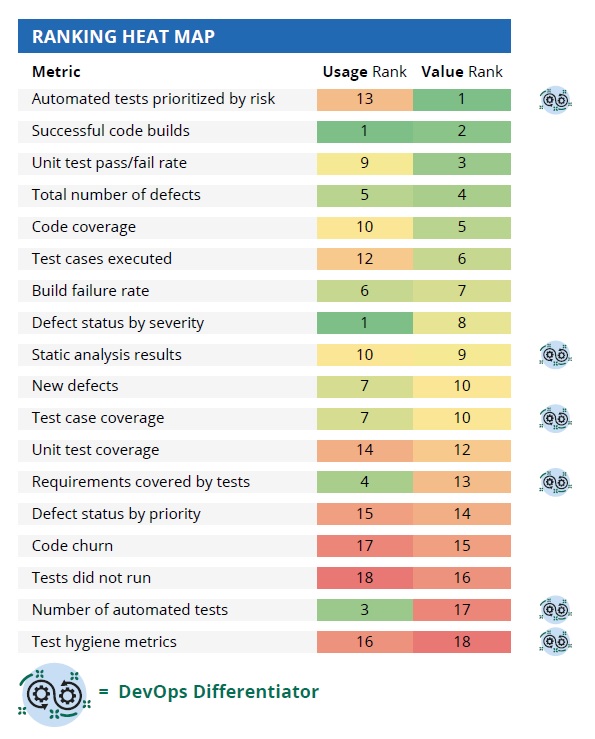
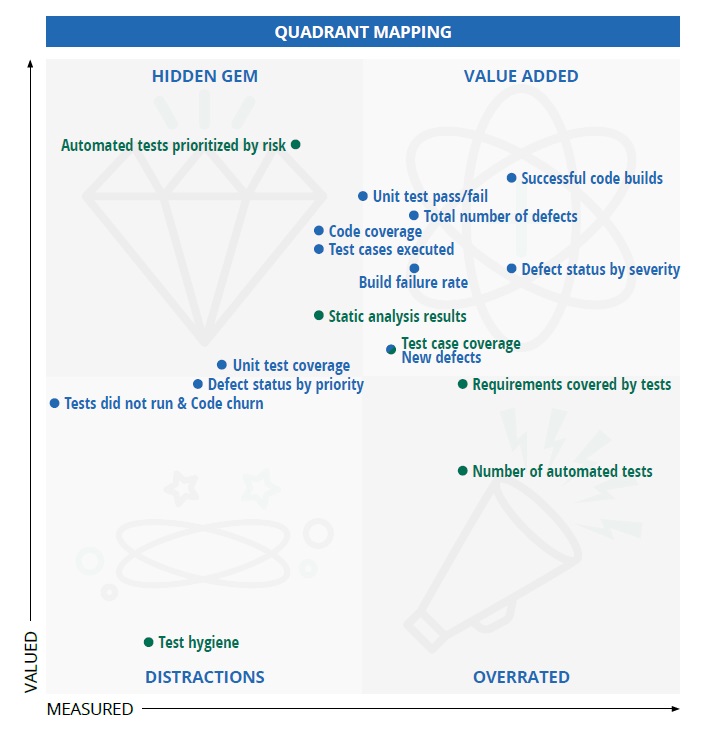
We also plotted the data for each metric into a quadrant with 4 sections:
■ Value added: Metrics that are used frequently by DevOps experts and consistently rated as valuable by the organizations who measure them.
■ Hidden gem: Metrics that are not used frequently by DevOps experts, but are consistently rated as valuable by the organizations who measure them.
■ Overrated: Metrics that are used frequently by DevOps experts, but not rated as valuable by the organizations who measure them.
■ Distraction: Metrics that are not used frequently by DevOps experts, and not rated as valuable by the organizations who measure them.
For example, here is the quadrant for Build category metrics:
The ebook(link is external) provides both heat maps and quadrants for all 4 categories, a quick look at each of the 75 metrics, per-category and overall analyses, and a few fun lists. Here’s a preview…
Hidden Gems
The following metrics are not commonly used (even among DevOps experts), but are ranked as extremely valuable by the select teams who actually measure them:
1. New defects (IT)
2. Critical defects (FV)
3. Automated tests prioritized by risk (Build)
4. Code coverage (Build)
5. Test cases executed (Build)
6. Static analysis results (Build)
7. Variance from baselines of percent of test cases passed (E2E)
8. Release readiness (E2E)
Top DevOps Differentiators
DevOps experts/leaders measure the following metrics significantly more than DevOps laggards measure them:
1. Automated tests prioritized by risk (Build)
2. Percent of automated E2E test cases (E2E)
3. Risk coverage (IT)
4. Release readiness (FV, IT, E2E)
5. Test efficiency (FV and IT)
6. Requirements covered by tests (Build, FV, IT, E2E)
7. Test case coverage (Build, E2E)
8. Static analysis results (Build)
9. Variance from baseline of percent of test cases passed (E2E)
10. Test effectiveness (FV, IT, E2E)
Most Used by DevOps Experts
The following metrics are the most frequently used (overall) by DevOps experts/leaders:
1. Test case coverage (E2E)
2. Pass/fail rate (FV)
3. API pass/fail rate (IT)
4. Number of tests executed (E2E)
5. API bug density (IT)
6. Requirements covered by tests (FV)
7. Requirements covered by tests (E2E)
8. Blocked test cases (FV)
9. Percent of automated E2E test cases (E2E)
10. Successful code builds (build)
Most Valued by DevOps Experts
The following metrics are the most highly-valued (overall) by DevOps experts/leaders:
1. Requirements covered by API tests (IT)
2. Percent of automated E2E tests (E2E)
3. Requirements covered by tests (E2E)
4. Requirements covered by tests (FV)
5. Count of critical functional defects (FV)
6. Total number of defects discovered in test (E2E)
7. Number of test cases executed (E2E)
8. Pass fail rate (FV)
9. New API defects found (IT)
10. Automated tests prioritized by risk (build)
Industry News
May 29, 2025
Sauce Labs announced the general availability of iOS 18 testing on its Virtual Device Cloud (VDC).
May 29, 2025
Infragistics announced the launch of Infragistics Ultimate 25.1, the company's flagship UX and UI product.
May 29, 2025
CIQ announced the creation of its Open Source Program Office (OSPO).
May 28, 2025
Check Point® Software Technologies Ltd.(link is external) announced the launch of its next generation Quantum(link is external) Smart-1 Management Appliances, delivering 2X increase in managed gateways and up to 70% higher log rate, with AI-powered security tools designed to meet the demands of hybrid enterprises.
May 28, 2025
Salesforce and Informatica have entered into an agreement for Salesforce to acquire Informatica.
May 28, 2025
Red Hat and Google Cloud announced an expanded collaboration to advance AI for enterprise applications by uniting Red Hat’s open source technologies with Google Cloud’s purpose-built infrastructure and Google’s family of open models, Gemma.
May 28, 2025
Mirantis announced Mirantis k0rdent Enterprise and Mirantis k0rdent Virtualization, unifying infrastructure for AI, containerized, and VM-based workloads through a Kubernetes-native model, streamlining operations for high-performance AI pipelines, modern microservices, and legacy applications alike.
May 28, 2025
Snyk launched the Snyk AI Trust Platform, an AI-native agentic platform specifically built to secure and govern software development in the AI Era.
May 28, 2025
Bit Cloud announced the general availability of Hope AI, its new AI-powered development agent that enables professional developers and organizations to build, share, deploy, and maintain complex applications using natural language prompts, specifications and design files.
May 27, 2025
AI-fueled attacks and hyperconnected IT environments have made threat exposure one of the most urgent cybersecurity challenges facing enterprises today. In response, Check Point® Software Technologies Ltd.(link is external) announced a definitive agreement to acquire Veriti Cybersecurity, the first fully automated, multi-vendor pre-emptive threat exposure and mitigation platform.
May 27, 2025
LambdaTest announced the launch of its Automation MCP Server, a solution designed to simplify and accelerate the process of triaging test failures.
May 27, 2025
DefectDojo announced the launch of their next-gen Security Operations Center (SOC) capabilities for DefectDojo Pro, which provides both SOC and AppSec professionals a unified platform for noise reduction and prioritization of SOC alerts and AppSec findings.
May 22, 2025
Check Point® Software Technologies Ltd.(link is external) has been recognized on Newsweek’s 2025 list of America’s Best Cybersecurity Companies(link is external).
May 22, 2025
Red Hat announced enhanced features to manage Red Hat Enterprise Linux.

